Monitor an Avalanche Node
Introduction
This tutorial demonstrates how to set up infrastructure to monitor an instance of AvalancheGo. We will use:
- Prometheus to gather and store data
node_exporterto get information about the machine,- AvalancheGo’s Metrics API to get information about the node
- Grafana to visualize data on a dashboard.
- A set of pre-made Avalanche dashboards
Prerequisites:
- A running AvalancheGo node
- Shell access to the machine running the node
- Administrator privileges on the machine
This tutorial assumes you have Ubuntu 20.04 running on your node. Other Linux
flavors that use systemd for running services and apt-get for package
management might work but have not been tested. Community member has reported it
works on Debian 10, might work on other Debian releases as well.
Caveat: Security
The system as described here should not be opened to the public internet. Neither Prometheus nor Grafana as shown here is hardened against unauthorized access. Make sure that both of them are accessible only over a secured proxy, local network, or VPN. Setting that up is beyond the scope of this tutorial, but exercise caution. Bad security practices could lead to attackers gaining control over your node! It is your responsibility to follow proper security practices.
Monitoring Installer Script
In order to make node monitoring easier to install, we have made a script that does most of the work for you. To download and run the script, log into the machine the node runs on with a user that has administrator privileges and enter the following command:
wget -nd -m https://raw.githubusercontent.com/ava-labs/avalanche-monitoring/main/grafana/monitoring-installer.sh ;\
chmod 755 monitoring-installer.sh;
This will download the script and make it executable.
Script itself is run multiple times with different arguments, each installing a different tool or part of the environment. To make sure it downloaded and set up correctly, begin by running:
./monitoring-installer.sh --help
It should display:
Usage: ./monitoring-installer.sh [--1|--2|--3|--4|--5|--help]

Options:
--help   Shows this message
--1      Step 1: Installs Prometheus
--2      Step 2: Installs Grafana
--3      Step 3: Installs node_exporter
--4      Step 4: Installs AvalancheGo Grafana dashboards
--5      Step 5: (Optional) Installs additional dashboards

Run without any options, script will download and install latest version of AvalancheGo dashboards.
Let's get to it.
Step 1: Set up Prometheus
Run the script to execute the first step:
./monitoring-installer.sh --1
It should produce output something like this:
AvalancheGo monitoring installer
--------------------------------
STEP 1: Installing Prometheus

Checking environment...
Found arm64 architecture...
Prometheus install archive found:
https://github.com/prometheus/prometheus/releases/download/v2.31.0/prometheus-2.31.0.linux-arm64.tar.gz
Attempting to download:
https://github.com/prometheus/prometheus/releases/download/v2.31.0/prometheus-2.31.0.linux-arm64.tar.gz
prometheus.tar.gz                           100%[=========================================================================================>]  65.11M   123MB/s    in 0.5s
2021-11-05 14:16:11 URL:https://github-releases.githubusercontent.com/6838921/a215b0e7-df1f-402b-9541-a3ec9d431f76?X-Amz-Algorithm=AWS4-HMAC-SHA256&X-Amz-Credential=AKIAIWNJYAX4CSVEH53A%2F20211105%2Fus-east-1%2Fs3%2Faws4_request&X-Amz-Date=20211105T141610Z&X-Amz-Expires=300&X-Amz-Signature=72a8ae4c6b5cea962bb9cad242cb4478082594b484d6a519de58b8241b319d94&X-Amz-SignedHeaders=host&actor_id=0&key_id=0&repo_id=6838921&response-content-disposition=attachment%3B%20filename%3Dprometheus-2.31.0.linux-arm64.tar.gz&response-content-type=application%2Foctet-stream [68274531/68274531] -> "prometheus.tar.gz" [1]
...
You may be prompted to confirm additional package installs, do that if asked. Script run should end with instructions on how to check that Prometheus installed correctly. Let's do that, run:
sudo systemctl status prometheus
It should output something like:
● prometheus.service - Prometheus
Loaded: loaded (/etc/systemd/system/prometheus.service; enabled; vendor preset: enabled)
Active: active (running) since Fri 2021-11-12 11:38:32 UTC; 17min ago
Docs: https://prometheus.io/docs/introduction/overview/
Main PID: 548 (prometheus)
Tasks: 10 (limit: 9300)
Memory: 95.6M
CGroup: /system.slice/prometheus.service
└─548 /usr/local/bin/prometheus --config.file=/etc/prometheus/prometheus.yml --storage.tsdb.path=/var/lib/prometheus --web.console.templates=/etc/prometheus/con>

Nov 12 11:38:33 ip-172-31-36-200 prometheus[548]: ts=2021-11-12T11:38:33.644Z caller=head.go:590 level=info component=tsdb msg="WAL segment loaded" segment=81 maxSegment=84
Nov 12 11:38:33 ip-172-31-36-200 prometheus[548]: ts=2021-11-12T11:38:33.773Z caller=head.go:590 level=info component=tsdb msg="WAL segment loaded" segment=82 maxSegment=84
Note the active (running) status (press q to exit). You can also check
Prometheus web interface, available on http://your-node-host-ip:9090/
You may need to do sudo ufw allow 9090/tcp if the firewall is on, and/or
adjust the security settings to allow connections to port 9090 if the node is
running on a cloud instance. For AWS, you can look it up
here.
If on public internet, make sure to only allow your IP to connect!
If everything is OK, let's move on.
Step 2: Install Grafana
Run the script to execute the second step:
./monitoring-installer.sh --2
It should produce output something like this:
AvalancheGo monitoring installer
--------------------------------
STEP 2: Installing Grafana

OK
deb https://packages.grafana.com/oss/deb stable main
Hit:1 http://us-east-2.ec2.ports.ubuntu.com/ubuntu-ports focal InRelease
Get:2 http://us-east-2.ec2.ports.ubuntu.com/ubuntu-ports focal-updates InRelease [114 kB]
Get:3 http://us-east-2.ec2.ports.ubuntu.com/ubuntu-ports focal-backports InRelease [101 kB]
Hit:4 http://ppa.launchpad.net/longsleep/golang-backports/ubuntu focal InRelease
Get:5 http://ports.ubuntu.com/ubuntu-ports focal-security InRelease [114 kB]
Get:6 https://packages.grafana.com/oss/deb stable InRelease [12.1 kB]
...
To make sure it’s running properly:
sudo systemctl status grafana-server
which should again show Grafana as active. Grafana should now be available at
http://your-node-host-ip:3000/ from your browser. Log in with username: admin,
password: admin, and you will be prompted to set up a new, secure password. Do
that.
You may need to do sudo ufw allow 3000/tcp if the firewall is on, and/or
adjust the cloud instance settings to allow connections to port 3000. If on
public internet, make sure to only allow your IP to connect!
Prometheus and Grafana are now installed, we're ready for the next step.
Step 3: Set up node_exporter
In addition to metrics from AvalancheGo, let’s set up monitoring of the machine
itself, so we can check CPU, memory, network and disk usage and be aware of any
anomalies. For that, we will use node_exporter, a Prometheus plugin.
Run the script to execute the third step:
./monitoring-installer.sh --3
The output should look something like this:
AvalancheGo monitoring installer
--------------------------------
STEP 3: Installing node_exporter

Checking environment...
Found arm64 architecture...
Dowloading archive...
https://github.com/prometheus/node_exporter/releases/download/v1.2.2/node_exporter-1.2.2.linux-arm64.tar.gz
node_exporter.tar.gz                        100%[=========================================================================================>]   7.91M  --.-KB/s    in 0.1s
2021-11-05 14:57:25 URL:https://github-releases.githubusercontent.com/9524057/6dc22304-a1f5-419b-b296-906f6dd168dc?X-Amz-Algorithm=AWS4-HMAC-SHA256&X-Amz-Credential=AKIAIWNJYAX4CSVEH53A%2F20211105%2Fus-east-1%2Fs3%2Faws4_request&X-Amz-Date=20211105T145725Z&X-Amz-Expires=300&X-Amz-Signature=3890e09e58ea9d4180684d9286c9e791b96b0c411d8f8a494f77e99f260bdcbb&X-Amz-SignedHeaders=host&actor_id=0&key_id=0&repo_id=9524057&response-content-disposition=attachment%3B%20filename%3Dnode_exporter-1.2.2.linux-arm64.tar.gz&response-content-type=application%2Foctet-stream [8296266/8296266] -> "node_exporter.tar.gz" [1]
node_exporter-1.2.2.linux-arm64/LICENSE
Again, we check that the service is running correctly:
sudo systemctl status node_exporter
If the service is running, Prometheus, Grafana and node_exporter should all work
together now. To check, in your browser visit Prometheus web interface on
http://your-node-host-ip:9090/targets. You should see three targets enabled:
- Prometheus
- AvalancheGo
avalanchego-machine
Make sure that all of them have State as UP.
If you run your AvalancheGo node with TLS enabled on your API port, you will
need to manually edit the /etc/prometheus/prometheus.yml file and change the
avalanchego job to look like this:
- job_name: "avalanchego"
  metrics_path: "/ext/metrics"
  scheme: "https"
  tls_config:
    insecure_skip_verify: true
  static_configs:
    - targets: ["localhost:9650"]
Mind the spacing (leading spaces too)! You will need admin privileges to do that
(use sudo). Restart Prometheus service afterwards with sudo systemctl restart prometheus.
All that's left to do now is to provision the data source and install the actual dashboards that will show us the data.
Step 4: Dashboards
Run the script to install the dashboards:
./monitoring-installer.sh --4
It will produce output something like this:
AvalancheGo monitoring installer
--------------------------------

Downloading...
Last-modified header missing -- time-stamps turned off.
2021-11-05 14:57:47 URL:https://raw.githubusercontent.com/ava-labs/avalanche-monitoring/master/grafana/dashboards/c_chain.json [50282/50282] -> "c_chain.json" [1]
FINISHED --2021-11-05 14:57:47--
Total wall clock time: 0.2s
Downloaded: 1 files, 49K in 0s (132 MB/s)
Last-modified header missing -- time-stamps turned off.
...
This will download the latest versions of the dashboards from GitHub and
provision Grafana to load them, as well as defining Prometheus as a data source.
It may take up to 30 seconds for the dashboards to show up. In your browser, go
to: http://your-node-host-ip:3000/dashboards. You should see 7 Avalanche
dashboards:
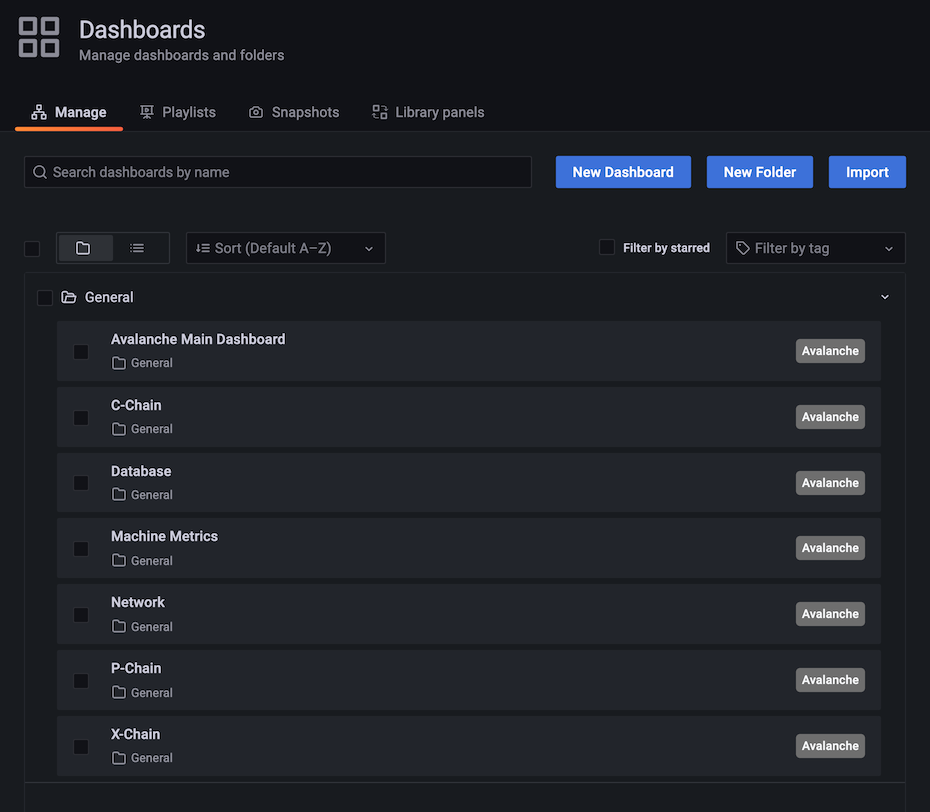
Select 'Avalanche Main Dashboard' by clicking its title. It should load, and look similar to this:
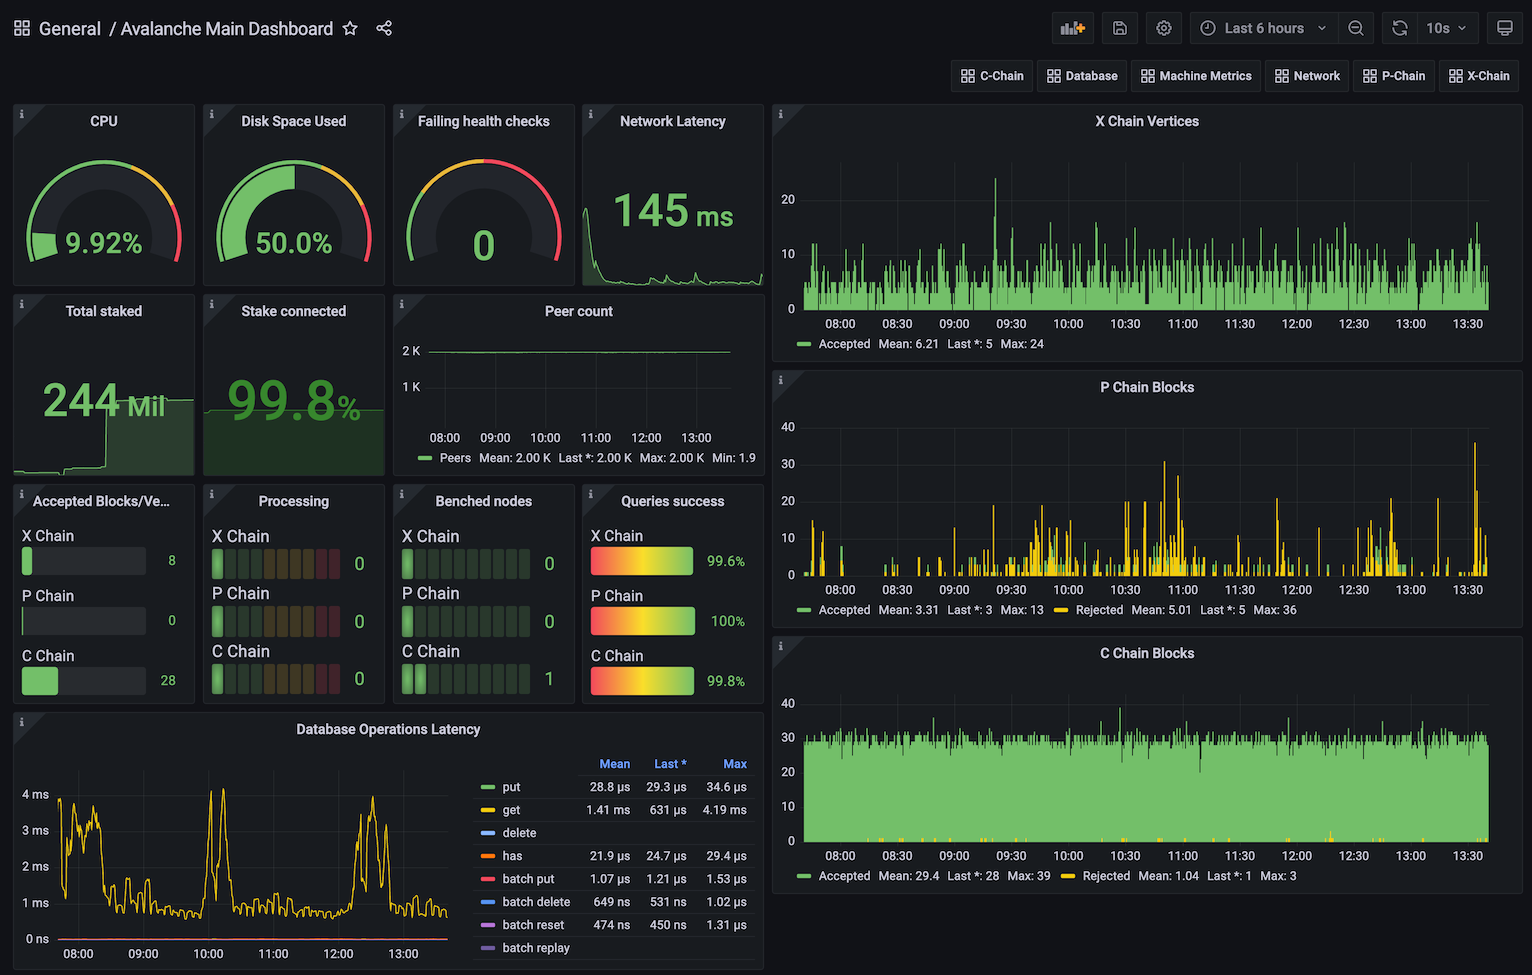
Some graphs may take some time to populate fully, as they need a series of data points in order to render correctly.
You can bookmark the main dashboard as it shows the most important information about the node at a glance. Every dashboard has a link to all the others as the first row, so you can move between them easily.
Step 5: Additional Dashboards (Optional)
Step 4 installs the basic set of dashboards that make sense to have on any node. Step 5 is for installing additional dashboards that may not be useful for every installation.
Currently, there is only one additional dashboard: Subnets. If your node is running any Subnets, you may want to add this as well. Do:
./monitoring-installer.sh --5
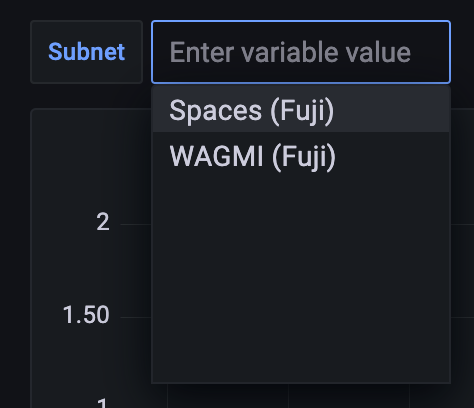
This will add the Subnets dashboard. It allows you to monitor operational data for any Subnet that is synced on the node. There is a Subnet switcher that allows you to switch between different Subnets. As there are many Subnets and not every node will have all of them, by default, it comes populated only with Spaces and WAGMI Subnets that exist on Fuji testnet:
To configure the dashboard and add any Subnets that your node is syncing, you
will need to edit the dashboard. Select the dashboard settings icon (image of
a cog) in the upper right corner of the dashboard display and switch to
Variables section and select the subnet variable. It should look something
like this:
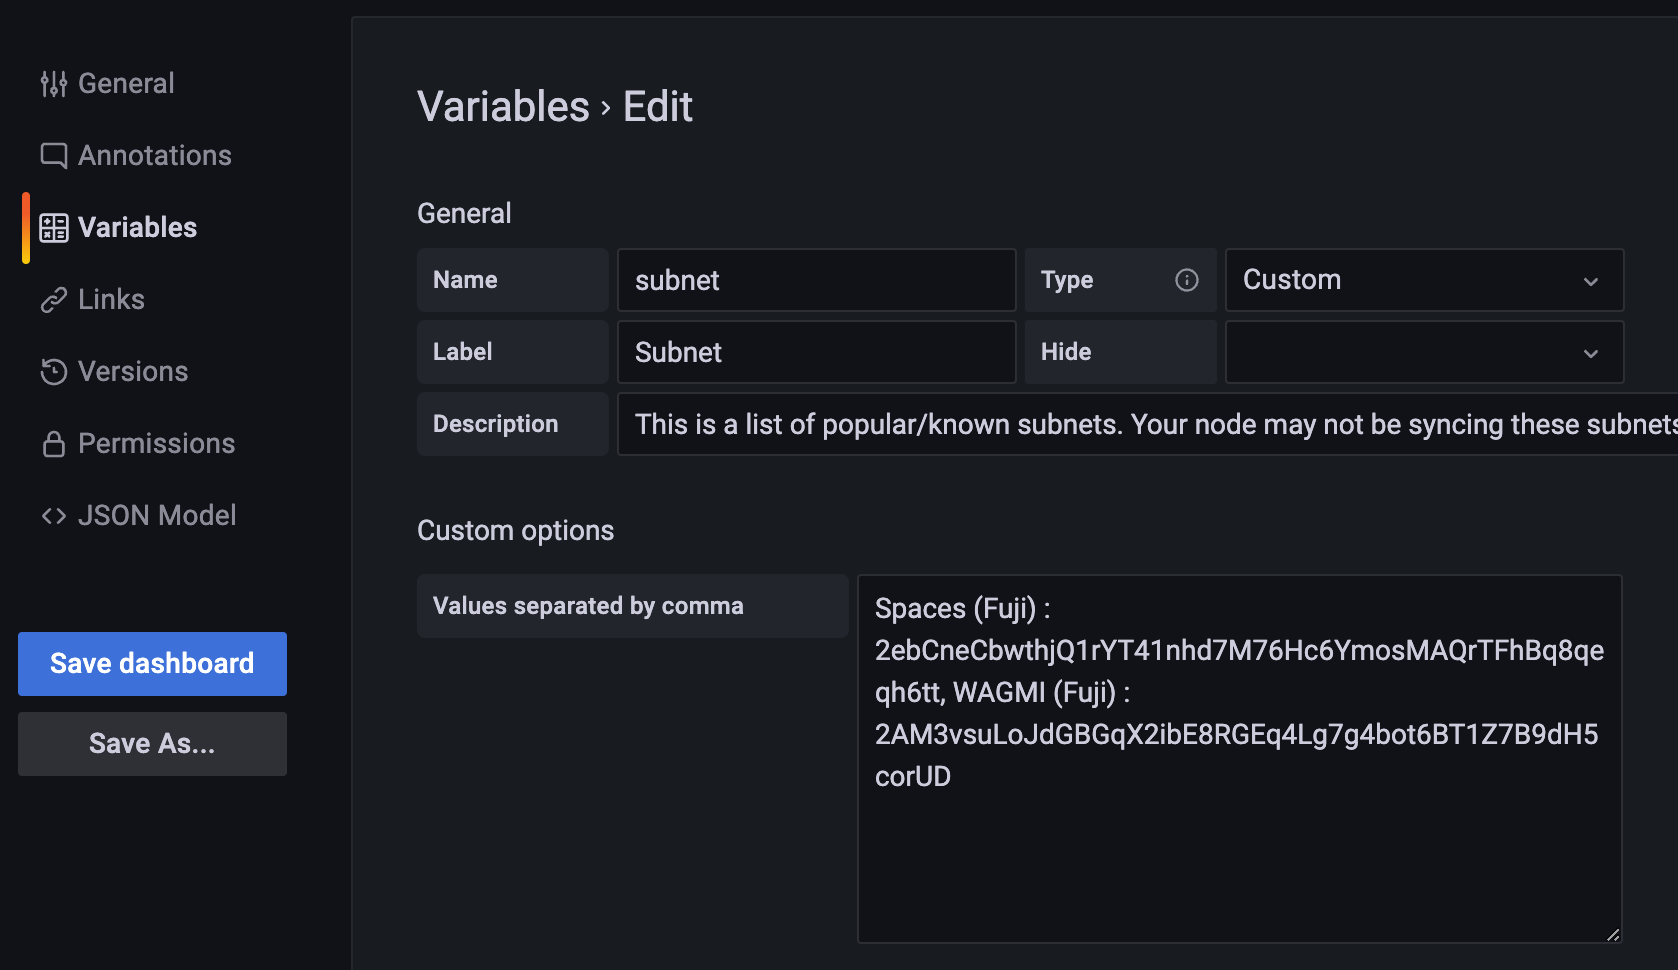
The variable format is:
Subnet name:<BlockchainID>
and the separator between entries is a comma. Entries for Spaces and WAGMI look like:
Spaces (Fuji) : 2ebCneCbwthjQ1rYT41nhd7M76Hc6YmosMAQrTFhBq8qeqh6tt, WAGMI (Fuji) : 2AM3vsuLoJdGBGqX2ibE8RGEq4Lg7g4bot6BT1Z7B9dH5corUD
After editing the values, press Update and then click Save dashboard button
and confirm. Press the back arrow in the upper left corner to return to the
dashboard. New values should now be selectable from the dropdown and data for
the selected Subnet will be shown in the panels.
Updating
Available node metrics are updated constantly, new ones are added and obsolete removed, so it is good a practice to update the dashboards from time to time, especially if you notice any missing data in panels. Updating the dashboards is easy, just run the script with no arguments, and it will refresh the dashboards with the latest available versions. Allow up to 30s for dashboards to update in Grafana.
If you added the optional extra dashboards (step 5), they will be updated as well.
Summary
Using the script to install node monitoring is easy, and it gives you insight into how your node is behaving and what's going on under the hood. Also, pretty graphs!
If you have feedback on this tutorial, problems with the script or following the steps, send us a message on Discord.
Was this page helpful?